Warning in readLines(input_file): incomplete final line found on
'C:/Users/NathanMoore/code/advent-of-code/2020/data-2020-01.txt'
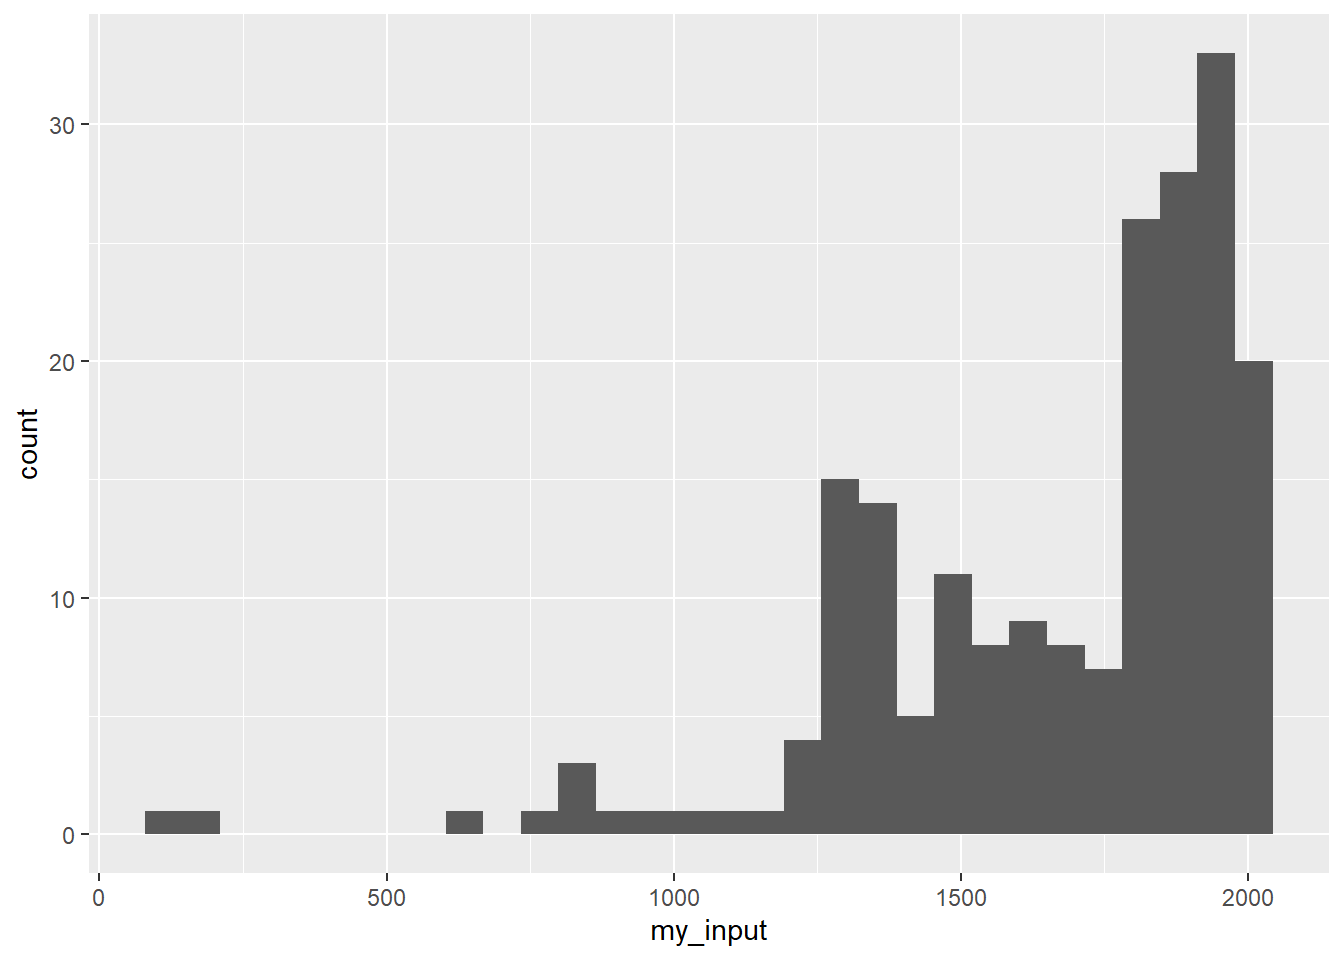
Let’s have a look at the data
# for plottingdf =as.data.frame(my_input)# have a lookggplot(df) +geom_histogram(aes(my_input))
`stat_bin()` using `bins = 30`. Pick better value `binwidth`.
# there is probably some value in sorting the list# lower values are likely to be included rather than two around 1000sorted_list =sort(my_input)# double loopfor (x inseq_along(sorted_list)) {for (y inseq_along(sorted_list)) {if (sorted_list[[x]] + sorted_list[[y]] ==2020) {print(sorted_list[[x]] * sorted_list[[y]]) } }}
[1] 1005459
[1] 1005459
— Part Two —
Actually, find three numbers that sum to 2020.
In your expense report, what is the product of the three entries that sum to 2020?